
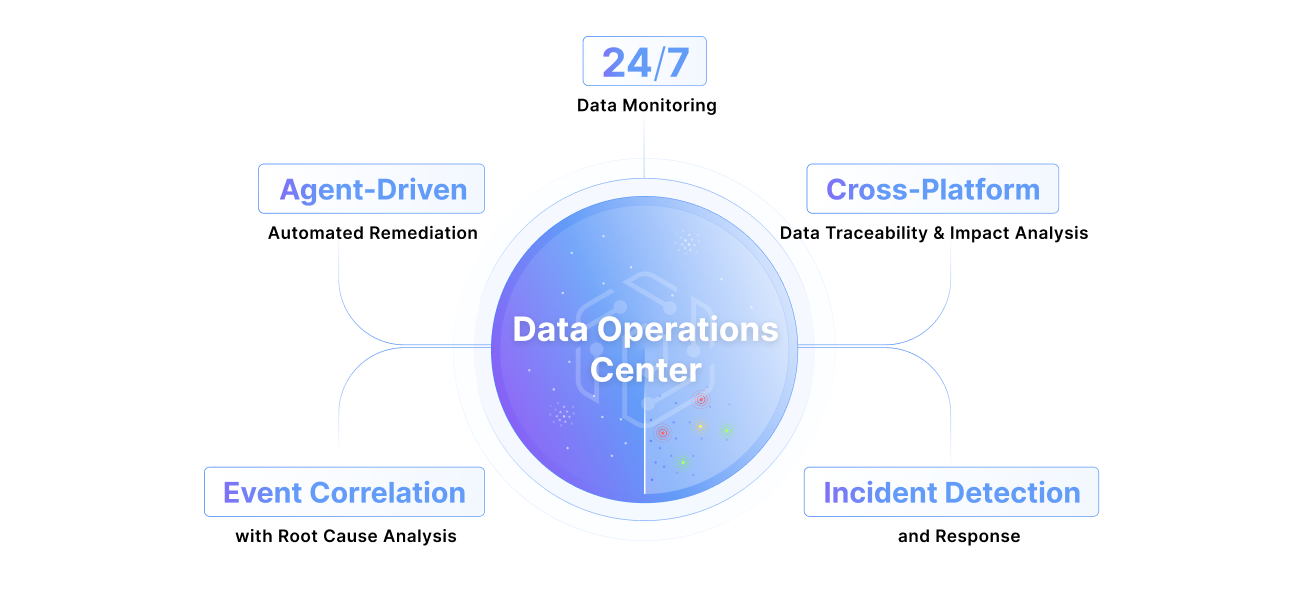
What is a data operations center?
Learn MoreWhat is a data operations center?
Learn More


You can’t simply implement data observability and then hope for the best. Learn about the top 10 essential metrics to make your business thrive.
10 Essential Metrics for Effective Data Observability

Data observability gives you the ability to understand and troubleshoot your data system's health and performance. But you can’t simply implement data observability and then hope for the best. You’ll only know how effective your data observability program is through rigorous measurement.
Tracking key metrics keeps you proactive about maintaining data quality and optimizing data operations. But if you’re not careful, you’ll suffer from measurement paralysis; after all, when it comes to managing warehouses of data and cross-system data pipelines, there’s a near-infinite list of numbers and metrics you could monitor.
While opinions may differ, in this post we’ll cast our votes for the ten most critical metrics for data observability, and explain why they matter the most.

1. Data Volume
Data volume refers to the amount of data being processed, stored, or transmitted within your data systems. The rate of change is how quickly this volume is increasing or decreasing over time.
On a technical level, a volume row count evaluates the number of rows within tables from a macro perspective on an hourly basis to identify any anomalies in row count. A rate of change check evaluates the rate at which the row count of a table is increasing or decreasing, in order to identify any anomalies.
These metrics are crucial because they help you predict future storage and processing needs. They also ensure that systems can handle current and future data loads. “Volume” and “rate of change” are like the great planners of a data observability framework; they provide the foresight needed to make informed decisions about infrastructure scaling, resource allocation, and capacity management. By closely monitoring these metrics, organizations can stay ahead of potential bottlenecks, avoid system overloads, and optimize their data architecture for both performance and cost-efficiency.
Moreover, these metrics serve as early warning systems for anomalies that might indicate either problems or opportunities. A sudden spike in data volume could signal a security breach, a viral marketing success, or an unexpected surge in customer activity. Conversely, a significant drop might point to data pipeline issues, service outages, or changes in user behavior. By keeping a vigilant eye on data volume and its rate of change, data teams can quickly detect and respond to anomalies that can lead to downstream issues.
Automated volume monitoring through data observability includes ML models that:
- Establish baseline metrics: This could involve collecting historical data on volume across different time periods (hourly, daily, weekly, monthly), then calculating average volumes and standard deviations for each period. For example, an e-commerce platform might establish that it processes an average of 1 million transactions daily, with a standard deviation of 100,000.
- Auto-configure alerting thresholds: Defining the upper and lower bounds for acceptable volume ranges (for example, “Alert if daily transaction volume exceeds 1.3 million (3 standard deviations above mean) or falls below 700,000 (3 standard deviations below mean).”
- Generate real-time dashboards: Creating visualizations that show current volume metrics compared to historical trends, and including key volume metrics for different data sources and categories.

2. Data Freshness
Data freshness refers to how up-to-date your data is at any given time. It's a critical metric because stale data can lead to incorrect insights and poor decision-making. You can measure it with many metrics, some of the most common being:
- Timestamp analysis
- Data age, recency, and/or expiry
- Freshness Service Level Agreements (SLAs)
Benchmarks vary by industry and use case. For example, a data analyst working in a large bank may create the following parameters around which to refresh data:
- Account balances: refresh data every 1 minute
- Fraud detection: refresh data every 1 second
- Monthly statements: refresh data 24 hours after month-end
Any data that hasn’t been refreshed according to these limits would be flagged for freshness checks.

3. Data Completeness
Data completeness ensures that all required information is present in your datasets. Incomplete data skews analysis and may tip your opinion toward inaccurate assumptions and analyses.
Teams generally measure data completeness with the following specific measurement techniques:
- Null value analysis
- Required field checks
- Schema validation
The impact of completeness on data quality cannot be overstated. Incomplete data sets can render entire analyses useless or, worse, misleading.

4. Data Latency
Latency measures the time delay between data creation and its availability for use. It’s critical to minimize latency in a business environment where the pressure to work quickly and produce things faster has never been higher.
So many businesses rely on real-time decision-making, like in finance or e-commerce where even milliseconds of delay can result in missed opportunities or losses. And, high latency can lead to slow-loading applications or websites, frustrating users and potentially driving them to competitors.
Key performance indicators for data latency might include:
- End-to-end processing time (the total time from data creation to its availability in the final destination (e.g., a dashboard or application)
- Query response time (how quickly your data systems can retrieve and return requested information)
- Real-time data delivery rates (the speed and consistency of data streaming processes)
By closely monitoring and optimizing latency metrics, organizations have a better chance at meeting the speed requirements of modern business operations.

5. Data Movement
Data movement refers to the process of transferring data from one location to another within your data ecosystem. This can involve moving data between different storage systems, databases, applications, or even between on-premises and cloud environments.
Effective data movement monitoring involves tracking a lot of the different aspects of these data transfer processes. You might measure the volume of data being moved, the speed of transfers, the frequency of data movements, or the success rate of transfer operations.
Data movement monitoring is important for identifying potential bottlenecks in data pipelines: network congestion, slow storage, inefficient protocols, and the like.

6. Data Accuracy
Accuracy in data observability means ensuring that the data correctly represents the real-world values it's supposed to measure. You can assess accuracy in a number of ways, like:
- Data validation rules
- Cross-reference checks
- Historical data comparison
- Statistical analysis
Accurate data correlates directly with business outcomes, no matter the sector in which you work. It impacts critical business functions like financial reporting, customer satisfaction, regulatory compliance, and product development. Essentially, there’s no area that data accuracy doesn’t touch across a business.

7. Job Operations
Job operations refer to the monitoring and management of data processing tasks within your data pipeline. These tasks, often called “jobs” or “workflows,” are the building blocks of data processing and analytics systems that move, stitch, cleanse and transform data. Effective monitoring of job operations is crucial for maintaining the health and efficiency of your data pipelines and infrastructure.
When you turn your attention to job operations, you’re looking at things like the percentage of jobs that complete successfully, versus those that fail. You’re also monitoring the duration of each job from start to finish and whether a job started at its scheduled time or not. Job failures, job latency, and jobs not starting on their scheduled time are often the cause of missing, stale and incomplete data. Essentially, job operations are a pretty clear indicator of overall pipeline health.

8. Cross-platform Data Pipeline Lineage (Data and job lineage)
Data and job lineage together provide a window into how data flows through an organization's systems. Data lineage tracks the entire lifecycle of data, from its origin (data producers) to its final destination (data consumers), including all the transformations and movements it undergoes along the way.
Job lineage, on the other hand, takes a more zoomed-in stance: it focuses on the relationships and dependencies between various data processing tasks, helping to visualize how different jobs or workflows interact with and depend on each other.
Measuring lineage comprehensiveness involves assessing factors like the coverage ratio (how much of the data ecosystem is captured in the lineage), metadata completeness (the depth and breadth of information captured about each data element and job), and granularity level (the level of detail in the lineage information).
A robust lineage tracking system can help your troubleshooting capabilities by allowing data teams to identify the root cause of issues. Downstream of good lineage tracking, you’ll get better impact analysis because you can actually see how changes in one part of the system might affect others.

9. Mean Time to Detection
Mean time to detection (MTTD) is a critical metric that simply measures how quickly an organization can identify issues or anomalies. The longer an issue goes undetected, the more significant its impact can be on data quality, system reliability, and ultimately, business operations.
MTTD is typically measured as the average time between when an issue first occurs and when it is detected by the organization's monitoring systems or personnel. A lower MTTD indicates a more responsive and effective observability strategy.
There are several key components to measuring detection speed. The mean time to detect itself provides an overall picture of how quickly issues are identified. Alerting response time measures how long it takes for an alert to be generated once an anomaly is detected by the system. The automated detection rate indicates what percentage of issues are caught by automated systems versus manual checks, which can significantly impact overall detection speed.

10. Mean Time to Resolution
Detecting an issue is one thing. Once an issue is detected, tracking the time it takes to resolve is essential for maintaining service levels. That’s the mean time to resolution (MTTR). MTTR begins when an issue is identified and ends when a resolution has been implemented and verified, encompassing the entire troubleshooting and remediation process.
MTTR’s importance cannot be overstated in the context of data systems. Long resolution times mean extended periods of data inaccuracy, system downtime, or degraded performance. By tracking and working to reduce MTTR, organizations can minimize the negative effects of data issues and demonstrate their commitment to maintaining robust and reliable data systems.
How do they improve MTTR? Usually by investing in training and tools to enhance technical capabilities, A real-time monitoring solution can significantly reduce both MTTD and MTTR. Additionally, staffing up and putting resources on on-call rotations to troubleshoot at any time of day. MTTR can also be improved with better documentation, so that users can self-serve the help they need. Forward-thinking technical teams might also implement post-incident reviews to learn from each issue.
Improving MTTR actually enhances an organization’s overall data observability posture. It indicates a culture of trust and data-driven decision-making.
Final Thoughts
Data observability is not just about individual metrics but about taking a holistic approach to understanding and optimizing your data systems.
The goal is not just to collect metrics, but to actually use them to drive continuous improvement in your data infrastructure. Regular review of your observability practices will maintain your data’s position as trustworthy fuel for your business engine.
Focus on the key metrics above to avoid overwhelm and safeguard the insights that drive your business forward. The rest is just noise.
Keep Reading
.png)
May 14, 2026
Rebuilding Lineage for Enterprise ScaleAt enterprise scale, data lineage stops being a UI feature and becomes a systems problem. We rebuilt Pantomath's Lineage Explorer from the ground up, new renderer, new data layer, new layout engine, to handle thousands of nodes without breaking a sweat.
Read More.png)
May 8, 2026
The Silent Killer of Enterprise AI: Why Your Agents Need a "Data Pulse"AI agents trust whatever data they're handed and fail confidently when it's wrong. Pantomath gives them an upstream data health check before they act.
Read More.png)
April 2, 2026
The Rise of the Data Reliability Engineer (DRE) and the Future of Data OperationsThe DRE is becoming essential as data systems grow more complex. Learn how this role helps teams reduce incidents, speed up root cause analysis, and keep data on time and accurate.
Read More