


Data Observability vs Data Quality: Key Differences
Data quality and data observability are interconnected disciplines that ensure the reliability and integrity of data systems.
Data quality originates from structured data management practices and focuses on:
- Validation rule engines for accuracy verification
- Schema enforcement mechanisms
- Cross-system reconciliation patterns
- Data profiling and standardization techniques
In contrast, data observability is developed to address modern pipeline complexity through:
- Real-time performance monitoring
- Automated anomaly detection
- Pipeline dependency tracking
- System health metrics collection
Organizations ideally implement both to increase efficiency and build trust in their data and the systems delivering it. This article explores the definitions, differences, and real-world applications of data quality and observability.

Data observability vs. data quality: Summary of differences
{{banner-large-2="/banners"}}
Understanding data quality and data observability
Let’s take a deep dive into what the two concepts mean in an organization.
Data quality

High-quality data is data that is fit for its intended use. It has the following six dimensions.
- Accuracy: Data is accurate if it is free from errors and correctly reflects the real-world entities it represents. For example, a customer's address in a database should be their actual physical address.
- Completeness: Data is complete if it contains all the necessary information. For example, a customer record should contain all the essential fields, such as name, address, and phone number.
- Consistency: Data is consistent if it is the same across all systems and platforms. For example, a customer's name should be the same in the CRM system, the marketing database, and the billing system.
- Timeliness: Data is timely if it is up-to-date and available when needed. For example, real-time stock prices should be updated every few seconds.
- Validity: Data is valid if it conforms to the predefined rules and standards. For example, a phone number should be in the correct format and contain the correct number of digits.
- Uniqueness: Data is unique if there are no duplicate records. For example, each customer should have only one record in the database.
Inaccurate reporting, poor analyses, and poor decision-making can result from poor data quality. In today's data-centric world, where organizations rely heavily on data for strategic planning and operational efficiency, maintaining high data quality is not just a technical necessity but a business imperative.
Key strategies to ensure data quality:
Data observability
Just as regular health check-ups catch issues early, data observability spots problems before they escalate. Observability tools help monitor metrics and alert you to deviations from expected behavior. For example, if a pipeline starts processing fewer rows than usual, an observability platform can pinpoint the root cause—a source system issue or a transformation error. Similarly, real-time anomaly detection and lineage tracking in observability tools help uncover blind spots, providing immediate insights into what went wrong and how to resolve it.

Data observability is built on five key pillars that provide comprehensive insights into pipeline performance and enable proactive issue resolution.
- Freshness: Ensures data is up-to-date and alerts for stale or outdated information. For example, in a retail environment, monitoring freshness can help ensure daily sales reports are updated promptly for accurate inventory management.
- Distribution: Monitors data patterns to detect anomalies, quality issues, or unexpected data structure changes. For example, identifying sudden spikes in transaction data that might indicate fraud in financial systems.
- Volume: Tracks data flow to identify bottlenecks, prevent missing data, and ensure smooth pipeline operations. For example, providing a consistent flow of customer activity logs in an e-commerce system to support personalized recommendations.
- Schema: Maintains consistency in data structures to avoid pipeline errors and ensure compatibility across systems. For example, validating schema consistency between a customer database and a CRM system to avoid syncing issues.
- Lineage: Provides traceability for data origin and transformations for troubleshooting and transparency. For example, tracing errors in analytics dashboards back to a misconfigured ETL transformation in a data pipeline.
Improving data observability involves implementing tools and practices that enhance visibility into data pipelines.
Organizations use the following strategies for enhancing data observability.
{{banner-small-5="/banners"}}
Integrating data quality and data observability
Data quality ensures the data is accurate, consistent, and reliable, while observability ensures the systems delivering that data operate smoothly. Together, these two disciplines create a synergistic effect: reducing downtime, enabling sharper analytics, and ensuring smooth operations across the board.

Integrating data quality and data observability equips organizations to effectively address two key categories of challenges.
- Known unknowns—Gaps you know about but haven’t resolved.
- Unknown unknowns—Surprises—issues you didn’t know could happen.
Known unknowns, such as incomplete records or inconsistent schemas, are tackled through data quality processes like validation and profiling. These structured approaches ensure datasets meet predefined standards.
Similarly, unknown unknowns, such as sudden schema changes or unexpected data anomalies, are uncovered through real-time observability features like anomaly detection and lineage tracking. These tools enable immediate identification and resolution of unforeseen issues.
For example, consider an e-commerce platform.
- Data quality checks validate that customer records are complete and consistent, ensuring a smooth user experience.
- Observability tools monitor the data pipeline, detecting unexpected surges in transaction logs that could indicate potential fraud.
By combining these approaches, businesses gain a comprehensive framework to understand, diagnose, and mitigate issues, whether anticipated or not.

This integrated approach enhances operational efficiency, fosters confidence in data-driven decision-making, and equips organizations with a comprehensive strategy to manage complex data environments.
Impact of integration failure
When organizations fail to integrate these two disciplines effectively, they face issues such as undetected data anomalies, inconsistent reports, and inefficient troubleshooting, leading to poor business decisions.
For example, imagine a global e-commerce company analyzing customer purchase trends. If the data observability tools detect delays in data ingestion but fail to trigger data quality validation, the analytics team might unknowingly work with incomplete purchase data This will lead to incorrect sales projections and inventory mismanagement despite observability tooling in place.
Organizations must align metrics, automate cross-system alerts, and create unified monitoring dashboards to prevent such failures.
Integration challenges
Modern data platforms use multiple systems for ingestion, transformation, storage, and analytics. Ensuring that data quality rules and observability alerts remain consistent across these systems is challenging.
Metric inconsistencies
Data observability tools track system performance metrics (latency, failures, anomalies), while data quality focuses on data accuracy metrics (completeness, consistency). Aligning them across tools requires standardization.
Siloed monitoring
Observability tools often focus on pipeline-level visibility, while data quality checks happen at the dataset level. Without integration, pipeline issues (e.g., a delay in ingestion) might not trigger a corresponding quality alert.
Unifying data quality and observability in dashboards
One of the biggest barriers to integration is the fragmentation of monitoring tools. Data teams have different dashboards for quality and observability. Data quality dashboards show validation rules, missing values, and duplicate records while observability dashboards display pipeline health, job failures, and latency metrics. Without a unified view, correlating pipeline failures with data quality issues becomes time-consuming.
Real-world examples
A fintech company processing real-time payment transactions experienced a spike in failed payments. Their observability tools detected increased latency within their payment processing pipeline, but no alerts were triggered for data quality validation. Upon investigation, the team discovered that the delayed pipeline caused missing transaction records, resulting in incorrect financial reports. Because observability and data quality metrics were not aligned, the system flagged latency issues but failed to validate whether all transactions were processed correctly.
A media streaming company tracks real-time user engagement data to optimize video recommendations. Observability tools flagged an increase in processing time in the data ingestion pipeline. However, the data quality dashboard did not trigger alerts because missing records were not automatically validated. As a result, user activity logs were incomplete, causing recommendation engines to underperform and leading to decreased user engagement.
When the data team realized the issue, incorrect recommendations affected thousands of users.
Integration solutions
- Define standardized monitoring metrics that include system-level (e.g., pipeline uptime, latency) and data-level (e.g., missing values, duplicates) checks.
- Use data lineage tracking to link pipeline anomalies with downstream data quality failures.
- Establish cross-system alerting so pipeline failures automatically trigger downstream data quality checks.
- Develop unified dashboards that overlay observability metrics (latency, failures) with data quality validation results (accuracy, consistency).
- Implement automated root cause analysis – When an issue is detected, dashboards should provide traceability from pipeline execution to data validation failures.
Unified dashboards
A critical outcome of integrating data quality and data observability is the ability to create unified dashboards. These dashboards combine validation checks with observability metrics in a single platform, offering a centralized view of data system health.
For example, a retailer can integrate a dashboard that monitors CRM data accuracy alongside pipeline delays metrics. This consolidated view bridges the gap between data quality and operational performance, empowering teams to diagnose and resolve issues faster.
Pantomath provides a single panel for the entire data pipeline where data teams can see the data quality checks alongside pipeline performance.

By centralizing metrics and validation checks, unified dashboards allow teams to make informed decisions based on real-time data insights. This ensures that both data quality standards and pipeline efficiency are maintained for seamless collaboration between data and engineering teams.
Lineage and metrics overlay
Displaying data quality metrics alongside pipeline health metrics provides essential context for understanding and troubleshooting issues. Imagine an e-commerce platform experiencing errors in its recommendation engine.
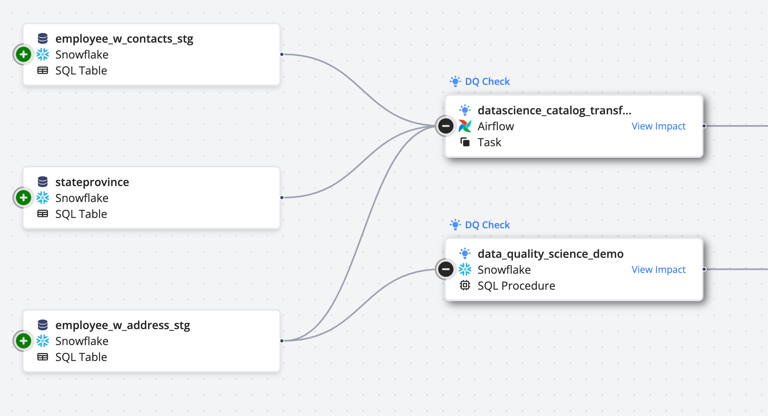
Pantomath's data lineage features provide a complete view of the data flow, so teams can trace issues back to their source and resolve them effectively. Pantomath empowers organizations to maintain reliable data systems and deliver accurate insights by overlaying data quality metrics with pipeline health metrics.
Automated workflows
Platforms like Pantomath exemplify how automation streamlines the integration of data quality and observability. By continuously monitoring datasets and workflows, Pantomath provides comprehensive, cross-platform technical lineage and real-time alerts. Key features include:
- Real-time alerts: Pantomath detects data reliability issues, triggering real-time alerts for immediate action.
- End-to-end lineage: It provides detailed pipeline lineage, helping to troubleshoot issues effectively.
- Impact analysis: Pantomath's integrated data lineage allows data teams to perform impact analysis when issues arise.
- Integration-ready: Pantomath supports a wide range of connectors for tools like Snowflake, ensuring seamless integration into existing data stacks.
Pantomath enhances data quality through:
- Enabling real-time alerting through the Data Quality Framework to ensure high data reliability standards.
- Customizable job-level monitoring enables critical processes to be labeled as data quality checks, providing insights into job performance and dataset health.
- Integrated incident management features that allow data teams to work faster.
Real-world integration example
Consider a financial services firm that processes millions of transactions daily. The firm relies on accurate and timely data to generate financial reports, detect fraudulent activities, and ensure compliance with regulatory requirements. However, the firm faced data inconsistencies and pipeline delays, leading to inaccurate reports and compliance risks.
Challenge
- The firm's data pipelines were complex, involving multiple data ingestion, transformation, and storage systems.
- Data quality issues, such as missing transaction records and schema inconsistencies, often went undetected until they impacted downstream reports.
- Pipeline delays caused by system bottlenecks were not immediately flagged, leading to outdated financial data.
Solution
The firm implemented Pantomath to automate data quality and observability workflows.
Pantomath's real-time alerting system detected anomalies in the data pipeline, such as sudden drops in transaction volume or schema changes. This allowed the data team to address issues before they impacted financial reports.
Their detailed lineage tracking enabled the team to trace data flow across systems. When a discrepancy was found in a financial report, the team could quickly identify the root cause, such as a misconfigured ETL job or a missing data source.
Pantomath's impact analysis feature also helped the firm understand the downstream effects of pipeline issues. For example, when a delay in data ingestion was detected, the platform highlighted which financial reports would be affected, allowing the team to prioritize fixes.
The firm was also able to integrate Pantomath seamlessly with their data warehouse (Snowflake), providing a unified view of data quality and pipeline health. This integration ensured that data quality checks were automatically triggered whenever pipeline issues were detected.
Outcome
- The firm significantly reduced data-related issues, with real-time alerts enabling proactive resolution of pipeline anomalies.
- Financial reports became more accurate and timely, improving decision-making and regulatory compliance.
- The data team saved hours of troubleshooting time by leveraging Pantomath's lineage tracking and impact analysis features.
{{banner-small-4="/banners"}}
Last thoughts
Data quality and observability are essential in ensuring modern data systems' reliability. Data quality focuses on datasets' accuracy, completeness, and consistency, while data observability looks at the health and performance of the pipelines that deliver that data. Together, they effectively address the challenges of today’s data environments.
Integrating these two aspects enhances operational efficiency and builds trust in data-driven decision-making. It also helps organizations manage known issues, such as incomplete records, and proactively identify anomalies, like pipeline disruptions.
Challenges remain, such as balancing real-time observability with batch quality checks. Overcoming these requires middleware solutions, hybrid pipelines, and unified dashboards that provide a centralized view of data and pipeline health.
Tools like Pantomath automate data quality and observability workflows, offering real-time alerts and lineage tracking features. By investing in these integrated solutions, organizations can reduce downtime, improve analytics, and foster a culture of trust and innovation, paving the way for sustainable growth in the data-driven era.