Data Quality Checks: Best Practices & Examples
Data quality is one of the five pillars of data observability. Proactively checking data prevents duplication, delays, and inaccuracies. It enhances stakeholders' trust by ensuring the data they rely on is fit for decision-making.
This article provides practical, actionable methods and best practices for implementing data quality checks using SQL and orchestrating them with Apache Airflow. Whether you are ensuring data accuracy in ETL/ELT processes, automating validation for cloud-based data lakes, or monitoring data timeliness for analytics, this guide will equip you with the essential best practices.
Summary of best practices for data quality checks
Data quality metrics
Well-defined data quality metrics ensure reliable data across your pipelines. These metrics typically focus on:
- Accuracy—correctness of data values
- Completeness—absence of missing fields
- Consistency—uniformity across systems
- Timeliness—data arriving within expected timeframes
Determining the most critical metrics for each dataset helps customize validation efforts to the data’s importance and role.
Here are several SQL queries you can use to define and track these key data quality metrics:
Check for missing data
Use the following SQL query to count missing values:
SELECT COUNT(*) AS missing_values
FROM my_table
WHERE key_field IS NULL;
For multiple fields, you can extend the query:
SELECT
    SUM(CASE WHEN field1 IS NULL THEN 1 ELSE 0 END) AS missing_field1,
    SUM(CASE WHEN field2 IS NULL THEN 1 ELSE 0 END) AS missing_field2
FROM my_table;
You can create similar SQL-based metrics to monitor other aspects, such as accuracy and timeliness, forming the basis of a robust data validation framework.
Data consistency across tables
Consistency checks ensure that data is uniform across different tables or systems. This query compares values from two tables to ensure consistency:
SELECT t1.id, t1.value, t2.value
FROM table1 t1
JOIN table2 t2 ON t1.id = t2.id
WHERE t1.value != t2.value;
You can identify discrepancies between two sources that should hold the same data.
Check data arrival time
You must ensure that time-sensitive records arrive within a specified timeframe. The following query checks if data was ingested within the past 24 hours.
SELECT COUNT(*) AS late_records
FROM my_table
WHERE timestamp_field < NOW() - INTERVAL 1 DAY;
This query checks that data arrives on time for daily reports or real-time dashboards.
No duplicate records
Use the following query to identify duplicates based on key fields:
SELECT key_field, COUNT(*) AS duplicate_count
FROM my_table
GROUP BY key_field
HAVING COUNT(*) > 1;
Verify foreign key relationships
Relational databases enforce referential integrity by foreign key constraints. This guarantees that records in one table correspond to valid entries in another, preventing orphaned records. However, referential integrity is not enforced automatically in BigQuery, Snowflake, and other data warehouses. Without manual checks, you risk having data that lacks proper relationships, leading to errors in analytics and reporting.
SELECT COUNT(*) AS orphaned_records
FROM child_table c
LEFT JOIN parent_table p ON c.parent_id = p.id
WHERE p.id IS NULL;
This query helps ensure that your data warehouse maintains logical consistency, even without built-in referential integrity enforcement. It prevents inconsistencies from propagating through your pipeline.
Data freshness
Up-to-date data is critical for maintaining the reliability of analytics, reporting, and decision-making processes. Verify data freshness by checking the latest timestamp in your dataset and comparing it against an expected update window. If the data is not updated within the defined timeframe, it is stale and may potentially violate service level agreements (SLAs). SLAs are predefined agreements between internal or external service providers and data consumers and often stipulate limits about missing or delayed data.
Use the following query to retrieve the most recent timestamp.
SELECT MAX(timestamp_field) AS last_update_time
FROM my_table;
To ensure SLA compliance, add another validation step that checks if the latest update falls within the required threshold. If the timestamp is older than the specified SLA window, it indicates stale data. You can then trigger necessary actions such as notifications or corrective measures.
WITH last_update AS (
    SELECT MAX(timestamp_field) AS last_update_time
    FROM my_table
)
SELECT
    last_update_time,
    CASE
        WHEN last_update_time < NOW() - INTERVAL '1 hour' THEN 'Stale Data: SLA Breached'
        ELSE 'Data is Up-to-Date'
    END AS status
FROM last_update;
This query calculates the MAX(timestamp_field)and compares the result against a threshold (in this case, 1 hour). If the latest update timestamp is older than the allowed SLA, the query returns a status indicating that the data is stale and the SLA has been breached. If the data falls within the acceptable window, it confirms it is up-to-date.
Integrating these SQL queries into your pipeline allows you to monitor key data quality metrics continuously.
{{banner-large="/banners"}}
Early operational checks
Implement data quality checks early in the pipeline to catch errors before propagating to downstream processes. This will prevent invalid data from reaching critical systems like analytics platforms or machine learning models.
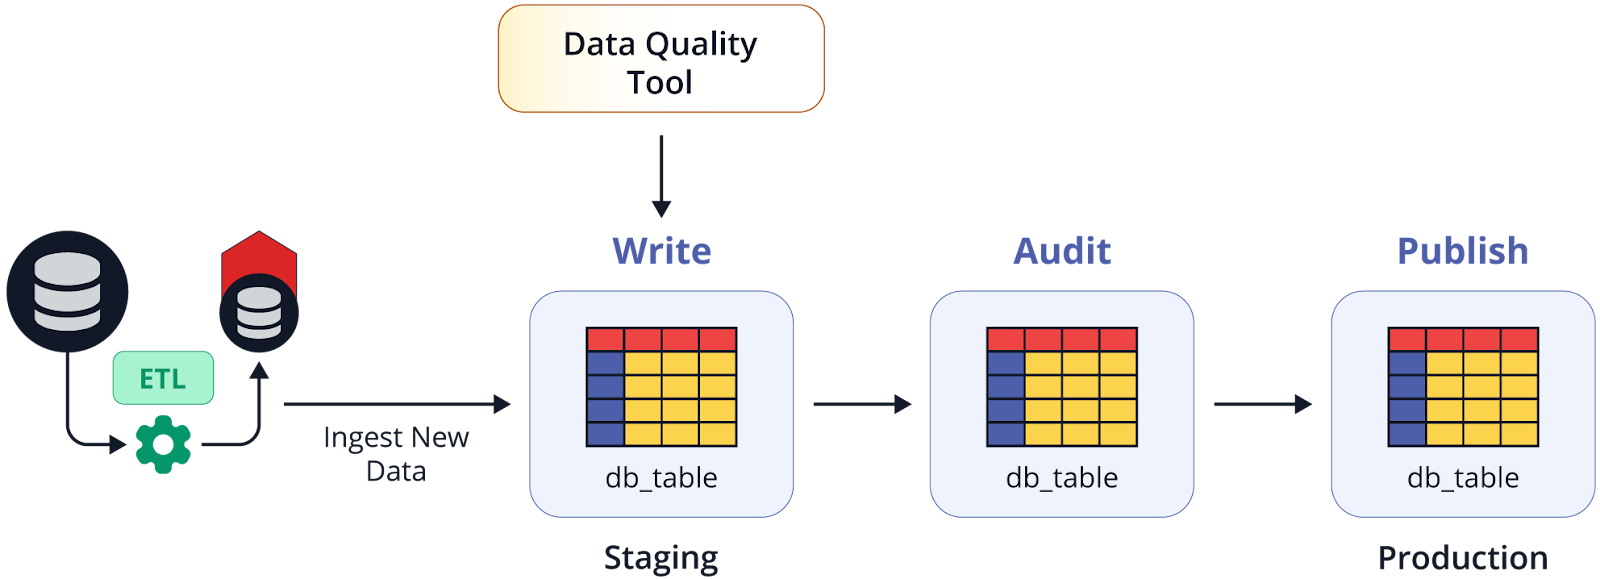
Here’s how you can perform early-stage data quality checks using both Snowflake and BigQuery, integrated with Airflow, to automate the validation process.
Example: Early Data Quality Check on BigQuery
For BigQuery, we use stored procedures to encapsulate multiple data checks, such as identifying missing or invalid data in a staging table.
CREATE OR REPLACE PROCEDURE check_early_stage_quality()
BEGIN
    DECLARE missing_values_count INT64;
    DECLARE invalid_values_count INT64;

    -- Check for missing values
    SELECT COUNT(*) INTO missing_values_count
    FROM `project.dataset.staging_table`
    WHERE important_field IS NULL;

    -- Check for invalid values
    SELECT COUNT(*) INTO invalid_values_count
    FROM `project.dataset.staging_table`
    WHERE numeric_field < 0;

    -- Raise an error if any issue is found
    IF missing_values_count > 0 OR invalid_values_count > 0 THEN
        RAISE USING MESSAGE = 'Data Quality Check Failed';
    END IF;
END;
from airflow import DAG
from airflow.providers.google.cloud.operators.bigquery import BigQueryInsertJobOperator
from airflow.operators.empty import EmptyOperator
from airflow.utils.dates import days_ago
default_args = {
'owner': 'airflow',
'start_date': days_ago(1),
'retries': 1,
}
with DAG('complex_data_quality_check_dag_bigquery', default_args=default_args, schedule_interval='@daily') as dag:
# Task: Extract Data
extract = EmptyOperator(task_id='extract')
# Task: Data Quality Check 1 - Early Stage Quality Check
data_quality_check_1 = BigQueryInsertJobOperator(
task_id='data_quality_check_1',
configuration={
"query": {
"query": "CALL `project.dataset.check_early_stage_quality`();",
"useLegacySql": False,
}
},
location='US',
gcp_conn_id='my_gcp_conn'
)
# Task: Post Check Action 1
post_check_action_1 = EmptyOperator(task_id='post_check_action_1')
# Task: Transform Data
transform = EmptyOperator(task_id='transform')
# Task: Data Quality Check 2
data_quality_check_2 = BigQueryInsertJobOperator(
task_id='data_quality_check_2',
configuration={
"query": {
"query": "SELECT COUNT(*) FROM `project.dataset.transformed_table` WHERE numeric_field < 0;",
"useLegacySql": False,
}
},
location='US',
gcp_conn_id='my_gcp_conn'
)
# Task: Post Check Action 2
post_check_action_2 = EmptyOperator(task_id='post_check_action_2')
# Task: Data Quality Check 3
data_quality_check_3 = BigQueryInsertJobOperator(
task_id='data_quality_check_3',
configuration={
"query": {
"query": "SELECT COUNT(*) FROM `project.dataset.final_table` WHERE some_other_check = 'fail';",
"useLegacySql": False,
}
},
location='US',
gcp_conn_id='my_gcp_conn'
)
# Task: Load Data to Production
load = EmptyOperator(task_id='load')
# Task Dependencies
extract >> data_quality_check_1 >> post_check_action_2
post_check_action_2 >> [data_quality_check_2, transform]
data_quality_check_2 >> load
transform >> data_quality_check_3 >> post_check_action_1Example: Early Data Quality Check on Snowflake
Similarly, for Snowflake, you can create a stored procedure to check early-stage data quality, which can be integrated into an Airflow DAG for automation.
CREATE OR REPLACE PROCEDURE check_early_stage_quality()
RETURNS STRING
LANGUAGE SQL
AS
$$
    DECLARE missing_values_count INTEGER;
    DECLARE invalid_values_count INTEGER;

    -- Check for missing values
    SELECT COUNT(*) INTO missing_values_count
    FROM staging_table
    WHERE important_field IS NULL;

    -- Check for invalid values
    SELECT COUNT(*) INTO invalid_values_count
    FROM staging_table
    WHERE numeric_field < 0;

    -- Return status
    IF missing_values_count > 0 OR invalid_values_count > 0 THEN
        RETURN 'Failed';
    ELSE
        RETURN 'Passed';
    END IF;
$$;
This stored procedure checks for missing values in important_field and invalid values in numeric_field. If any issues are found, it returns a failure message.
You can integrate these SQL validation queries into an Airflow DAG to automate early checks in the pipeline. Here is an example of an Airflow DAG that runs right after data ingestion to a staging table.
from airflow import DAG
from airflow.providers.snowflake.operators.snowflake import SnowflakeOperator
from airflow.operators.empty import EmptyOperator
from airflow.utils.dates import days_ago

default_args = {
    'owner': 'airflow',
    'start_date': days_ago(1),
    'retries': 1,
}

with DAG('complex_data_quality_check_dag', default_args=default_args, schedule_interval='@daily') as dag:

    # Task: Extract Data
    extract = EmptyOperator(task_id='extract')

    # Task: Data Quality Check 1
    data_quality_check_1 = SnowflakeOperator(
        task_id='data_quality_check_1',
        snowflake_conn_id='my_snowflake_conn',
        sql="CALL check_early_stage_quality();"
    )

    # Task: Post Check Action 1
    post_check_action_1 = EmptyOperator(task_id='post_check_action_1')

    # Task: Transform Data
    transform = EmptyOperator(task_id='transform')

    # Task: Data Quality Check 2
    data_quality_check_2 = SnowflakeOperator(
        task_id='data_quality_check_2',
        snowflake_conn_id='my_snowflake_conn',
        sql="CALL check_after_transform_quality();"
    )

    # Task: Post Check Action 2
    post_check_action_2 = EmptyOperator(task_id='post_check_action_2')

    # Task: Data Quality Check 3
    data_quality_check_3 = SnowflakeOperator(
        task_id='data_quality_check_3',
        snowflake_conn_id='my_snowflake_conn',
        sql="CALL check_final_stage_quality();"
    )

    # Task: Load Data to Production
    load = EmptyOperator(task_id='load')

    # Task Dependencies
    extract >> data_quality_check_1 >> post_check_action_2
    post_check_action_2 >> [data_quality_check_2, transform]
    data_quality_check_2 >> load
    transform >> data_quality_check_3 >> post_check_action_1
Integrating stored procedures in Snowflake and BigQuery with Airflow allows you to automate your data quality checks early in the data pipeline. This ensures that data quality issues are caught before data is passed through transformation stages or loaded into production, protecting downstream processes like analytics or machine learning from bad data.

Early-stage checks can be visually integrated into an Airflow DAG to illustrate how data flows through the pipeline and where validation steps occur.
Continuous monitoring with automated checks
Regular checks on the production tables ensure data integrity over time. They help detect and address data quality issues that might emerge after data has been loaded into the data warehouse. You get an extra layer of protection for long-term data reliability. Automating these checks ensures data quality issues are detected as they occur.
Airflow can also automate data quality checks on your final tables. You can tailor the checks to monitor specific metrics across different database systems.
For example, the Airflow task checks for both invalid numeric values and whether the latest data in the final BigQuery table meets freshness requirements:
from airflow import DAG
from airflow.providers.google.cloud.operators.bigquery import BigQueryExecuteQueryOperator
from airflow.providers.google.cloud.operators.bigquery import BigQueryCheckOperator
from airflow.operators.email_operator import EmailOperator
from airflow.utils.dates import days_ago

default_args = {
    'owner': 'airflow',
    'start_date': days_ago(1),
    'retries': 1,
    'email_on_failure': True,
    'email': ['data_team@example.com'],
}

with DAG('bigquery_final_table_quality_checks_with_alerts',
         default_args=default_args,
         schedule_interval='@daily') as dag:

    # Check for invalid values (e.g., negative values in a numeric field)
    check_invalid_values = BigQueryCheckOperator(
        task_id='check_invalid_values',
        sql="""
            SELECT IF(COUNT(*) > 0, True, False) as check_status
            FROM `project.dataset.final_table`
            WHERE numeric_field < 0;
        """,
        use_legacy_sql=False,
        gcp_conn_id='google_cloud_default',
        location='US'
    )

    # Check for data freshness, with SLA (1 hour window)
    check_freshness = BigQueryCheckOperator(
        task_id='check_freshness',
        sql="""
            WITH last_update AS (
                SELECT MAX(timestamp_field) AS last_update_time
                FROM `project.dataset.final_table`
            )
            SELECT
                CASE
                    WHEN last_update_time < TIMESTAMP_SUB(CURRENT_TIMESTAMP(), INTERVAL 1 HOUR)
                    THEN False
                    ELSE True
                END AS check_status
            FROM last_update;
        """,
        use_legacy_sql=False,
        gcp_conn_id='google_cloud_default',
        location='US'
    )

    # Email notification if any of the checks fail
    send_alert = EmailOperator(
        task_id='send_alert',
        to='data_team@example.com',
        subject='Data Quality Check Failed',
        html_content="""<h3>Data quality check has failed in BigQuery.</h3>
                        Please review the Airflow logs for further details."""
    )

    # Set task dependencies: if any check fails, send an alert
    [check_invalid_values, check_freshness] >> send_alert
This DAG ensures that the final table does not contain duplicate records and monitors data freshness.
Schema validation
Schema validation ensures your data conforms to expected structures before it proceeds through the pipeline. It checks for required columns, data types, valid values like enums, and constraints like non-null conditions or positive values.
Validate column presence and data types
Here’s an example query using information_schema to validate column presence.
SELECT column_name, data_type
FROM information_schema.columns
WHERE table_name = 'my_table'
AND column_name IN ('expected_column1', 'expected_column2', 'expected_column3');
This query checks that each required column exists and matches the expected data type.
Check for Null Values
SELECT COUNT(*) AS null_count
FROM my_table
WHERE important_column IS NULL;
If the result is greater than zero, it indicates that null values exist where they shouldn’t, prompting immediate action.
Validating positive and negative values
Use the following query to ensure numeric fields contain only positive values (when required).
SELECT COUNT(*) AS negative_values_count
FROM my_table
WHERE numeric_field < 0;
This query flags records with invalid negative values in fields expected to be positive.
Enum validation
Validate categorical fields (enums) contain only permissible values.
SELECT COUNT(*) AS invalid_enum_values
FROM my_table
WHERE status_field NOT IN ('active', 'inactive', 'pending');
This query ensures that the field only contains the predefined valid values.
Automating schema validation with Airflow
Here’s an example of a DAG that runs multiple checks on a daily schedule.
from airflow import DAG
from airflow.operators.mysql_operator import MySqlOperator
from airflow.utils.dates import days_ago

default_args = {
    'owner': 'airflow',
    'start_date': days_ago(1),
    'retries': 1,
}

with DAG('schema_validation_dag', default_args=default_args, schedule_interval='@daily') as dag:

    validate_column_presence = MySqlOperator(
        task_id='validate_column_presence',
        mysql_conn_id='mysql_conn',
        sql="""
            SELECT column_name, data_type
            FROM information_schema.columns
            WHERE table_name = 'my_table'
            AND column_name IN ('expected_column1', 'expected_column2', 'expected_column3');
        """,
    )

    validate_null_values = MySqlOperator(
        task_id='validate_null_values',
        mysql_conn_id='mysql_conn',
        sql="SELECT COUNT(*) FROM my_table WHERE important_column IS NULL;",
    )

    validate_positive_values = MySqlOperator(
        task_id='validate_positive_values',
        mysql_conn_id='mysql_conn',
        sql="SELECT COUNT(*) FROM my_table WHERE numeric_field < 0;",
    )

    validate_enum_values = MySqlOperator(
        task_id='validate_enum_values',
        mysql_conn_id='mysql_conn',
        sql="SELECT COUNT(*) FROM my_table WHERE status_field NOT IN ('active', 'inactive', 'pending');",
    )

    validate_column_presence >> [validate_null_values, validate_positive_values, validate_enum_values]
In this example, each task checks different schema aspects while running sequentially or in parallel as required. Task failure indicates the specific issue, allowing quick resolution.
Alerts and monitoring
Traceability and observability ensure data quality as it flows through various processing stages. Data traceability tracks data lineage from the source to its final destination. On the other hand, observability provides real-time visibility into the pipeline's internal state. You monitor data as it moves through different transformations and checks. Together, traceability and observability give data engineers the tools to understand data flow, detect anomalies, and quickly pinpoint the root causes of any data quality issues.
Connecting traceability to alerts and monitoring
You can configure Airflow and Prometheus to trigger alerts when thresholds are breached. Here’s how you can set up a basic alert system.
from airflow import DAG
from airflow.operators.python_operator import BranchPythonOperator
from airflow.providers.google.cloud.operators.bigquery import BigQueryInsertJobOperator
from airflow.operators.email_operator import EmailOperator
from airflow.operators.dummy_operator import DummyOperator
from airflow.utils.dates import days_ago

default_args = {
    'owner': 'airflow',
    'start_date': days_ago(1),
    'retries': 1,
}

def branch_task(**kwargs):
    # Directs the DAG based on the success or failure of the data quality check
    result = kwargs['ti'].xcom_pull(task_ids='run_quality_check')['statistics']['totalRows']
    return 'send_alert_failure' if result == '0' else 'send_alert_success'

with DAG('data_quality_monitoring_dag', default_args=default_args, schedule_interval='@daily') as dag:

    run_quality_check = BigQueryInsertJobOperator(
        task_id='run_quality_check',
        configuration={
            "query": {
                "query": "SELECT COUNT(*) FROM `project.dataset.table` WHERE column IS NOT NULL;",
                "useLegacySql": False,
            }
        },
        location='US'
    )

    branching = BranchPythonOperator(
        task_id='branch_task',
        python_callable=branch_task,
        provide_context=True,
    )
    send_alert_success = EmailOperator(
        task_id='send_alert_success',
        to='data_team@example.com',
        subject='Data Quality Check Passed',
        html_content='<h3>Data quality check passed successfully. Data integrity is maintained.</h3>'
    )

    send_alert_failure = EmailOperator(
        task_id='send_alert_failure',
        to='data_team@example.com',
        subject='Data Quality Alert: Issue Detected',
        html_content='<h3>Data quality check has failed. Immediate attention is required.</h3>'
    )

    end_task = DummyOperator(task_id='end_task')

    run_quality_check >> branching >> [send_alert_success, send_alert_failure, end_task]
In this example, the data team is notified when the data quality check fails.
{{banner-large="/banners"}}
Real-time monitoring with Pantomath incident management
Using Airflow with Prometheus requires development effort. They also don't inherently correlate data lineage with operational data quality insights.
Pantomath enhances this process with its SmartOps-powered incident management features, automatically generating actionable incidents containing root-cause analysis results.
Each incident details key information, such as the affected data asset, incident type (e.g., volume, latency), pipeline impact, and platform error message. Incidents are organized and labeled (e.g., "PTM-25"), enabling teams to quickly assess the problem’s impact.
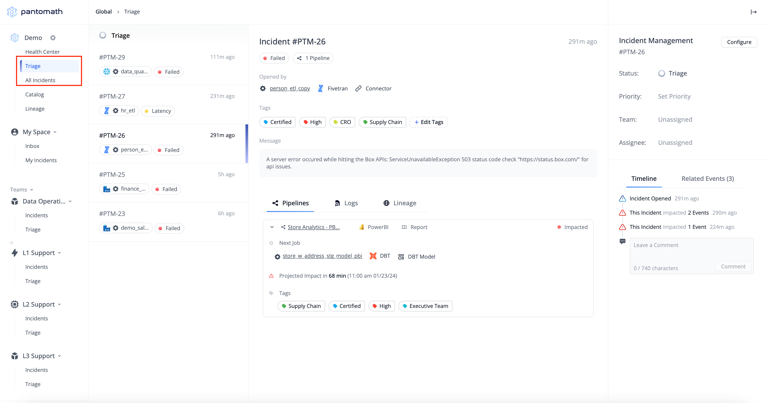
You can manage incidents by setting their status (e.g., triage, acknowledged) and priority levels and assigning them to specific team members for resolution. Pantomath’s incident details also include tools for configuring monitoring thresholds and creating tailored alerts aligned with specific pipeline needs.
This comprehensive incident management system improves pipeline health and fosters better communication and faster resolution of data issues across teams.
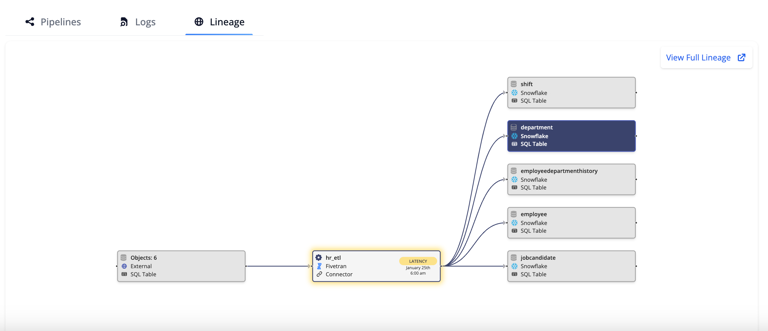
Combining operational monitoring and alerting with data lineage information provides a comprehensive view of the data flow, referred to as pipeline lineage. Pipeline lineage visualization identifies the specific data asset affected by latency or other anomalies in the data journey. It traces the effect across interconnected tables or jobs so you can see how issues in one part of the pipeline affect downstream processes. This integrated approach enables faster root cause analysis and more effective incident management.
Data reconciliation
Data reconciliation ensures consistency and uniformity across different systems or sources. It is especially vital when data is ingested from multiple origins and needs to be aligned, compared, and combined meaningfully.
Data reconciliation between BigQuery and MySQL using Pandas
The next example demonstrates how to extract data from BigQuery and MySQL, perform a join using Pandas, and validate consistency within an Airflow PythonOperator.
from airflow import DAG
from airflow.operators.python_operator import PythonOperator
from airflow.utils.dates import days_ago
import pandas as pd
from google.cloud import bigquery
import mysql.connector

def reconcile_data():
    # Extract data from BigQuery
    client = bigquery.Client()
    query = "SELECT id, value FROM `project.dataset.bigquery_table`"
    bigquery_df = client.query(query).to_dataframe()

    # Extract data from MySQL
    conn = mysql.connector.connect(
        host='mysql_host',
        user='username',
        password='password',
        database='database_name'
    )
    mysql_df = pd.read_sql("SELECT id, value FROM mysql_table", conn)
    # Perform reconciliation using pandas join
    merged_df = pd.merge(bigquery_df, mysql_df, on='id', how='outer', indicator=True)
    discrepancies = merged_df[merged_df['_merge'] != 'both']
    if not discrepancies.empty:
        print("Discrepancies found:", discrepancies)

default_args = {'owner': 'airflow', 'start_date': days_ago(1)}
with DAG('data_reconciliation_dag', default_args=default_args, schedule_interval='@daily') as dag:
    reconcile_task = PythonOperator(
        task_id='reconcile_data_task',
        python_callable=reconcile_data
    )
This approach performs an outer join to identify discrepancies. Any records that don’t match between the two datasets are flagged for further review.
Data reconciliation between two BigQuery tables using SQL
For scenarios where both datasets reside within BigQuery, you can directly use SQL to perform the consistency check:
SELECT a.id, a.value AS bigquery_value, b.value AS comparison_value
FROM `project.dataset.table_a` a
FULL OUTER JOIN `project.dataset.table_b` b
ON a.id = b.id
WHERE a.value != b.value OR a.id IS NULL OR b.id IS NULL;
This query identifies discrepancies by performing a full outer join between two tables, highlighting differences or missing records that need attention.
Root cause analysis for data quality issues
Root Cause Analysis (RCA) goes beyond fixing surface-level symptoms to identify the underlying reasons behind data quality failures. Usually required as part of an operational retrospective or post-mortem (a meeting of engineers and operations team members held to identify the cause of an incident to stop it from happening again), it helps prevent recurring issues and enhances long-term pipeline stability.
Establish a systematic RCA process whenever a data quality issue arises. Leverage logs, monitoring tools, and data lineage tracking to pinpoint where the problem originated—data source, transformation steps, or external integrations.
Suppose a data inconsistency is detected in your pipeline. Using Airflow's logs and lineage tracking tools, you can trace the issue back to its source, such as a corrupted file in the data ingestion layer or a schema mismatch during transformation. This traceability helps target the exact point of failure, allowing for more effective resolution.
In contrast, Pantomath provides advanced data lineage and observability features to visually map the data journey. It can trace data from its origin to the point of failure, highlighting critical paths and dependencies. It illustrates upstream and downstream dependencies so you can identify and fix data quality issues at their root.

Documenting data quality processes
Clear documentation of data quality processes ensures transparency and consistency across teams. Documenting data quality checks, metrics, and workflows creates a solid foundation that fosters team collaboration. This documentation becomes even more valuable during data quality incidents when a well-defined rollback or cutover plan can differentiate between swift recovery and prolonged disruptions.
When a data quality incident occurs, a fallback or rollback strategy mitigates the impact on downstream processes. A cutover plan ensures a smooth transition back to stable data or an alternative data set, minimizing disruption to analytics and decision-making workflows.
Use tools like Confluence, Notion, or Git-based systems to document data quality processes comprehensively. Here are some recommended elements to include in your documentation:
- Define key metrics such as completeness, accuracy, consistency, and timeliness.
- SQL queries used for validation
- Incident response plans
- Fallback strategy
- Cutover plan
- Incident management workflow
- Steps for triage
Advanced tools for data quality management
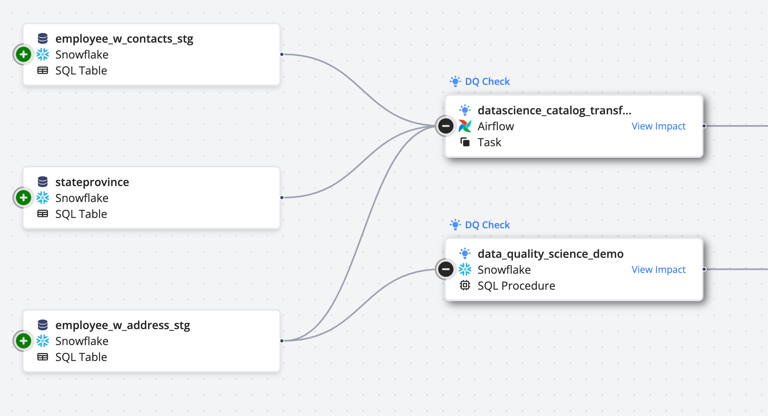
Pantomath offers data quality and incident management features that empower data teams to monitor and manage data quality proactively. The platform allows users to easily create Data Quality (DQ) Jobs through its intuitive UI, manual toggles, and automated naming conventions. The DQ Jobs are integrated into the pipeline lineage diagram (which combines data lineage with operational monitoring) to visually highlight dependencies, helping teams troubleshoot more effectively by understanding how data quality check failures impact downstream data pipeline stages.
{{banner-small-1="/banners"}}
Conclusion
Data quality checks are essential to maintaining reliable data pipelines, ensuring that analytics and decision-making processes are based on accurate and trustworthy information. SQL-based checks and Airflow automation promote proactive monitoring for early issue detection.
Pantomath amplifies these efforts by offering a powerful Data Quality Framework integrated with incident management and data lineage visualization. Its intuitive UI allows teams to quickly set up and monitor DQ Jobs to detect and address data anomalies. With automatic alerts and detailed data lineage diagrams, Pantomath empowers teams to quickly trace data issues to their source, fostering collaboration and swift resolution.
Adopting these best practices and tools enhances data reliability and supports a culture of continuous improvement in data management. Organizations can significantly boost their data quality efforts, leading to more confident and informed decision-making.


