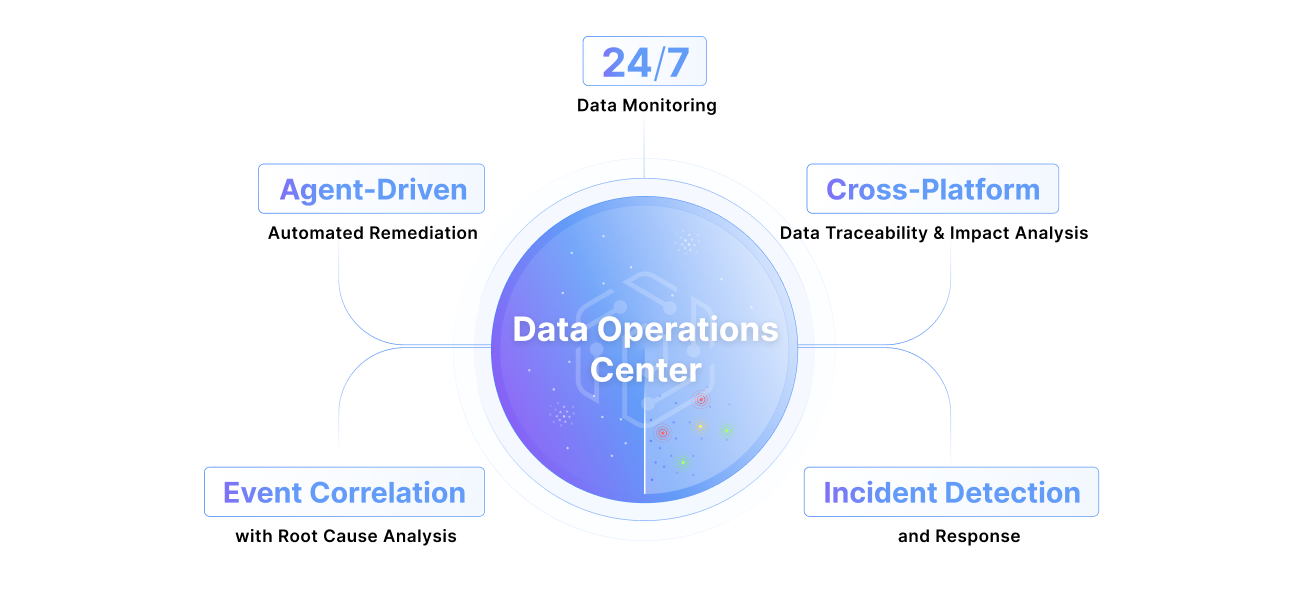
Data Quality Framework: Modern Best Practices
A data quality framework is a structured set of principles, processes, and tools organizations adopt to meet data quality standards. Such a framework implements secure and comprehensive checks on data pipelines from source to destination. As data volumes, complexity, and machine learning requirements have increased since the turn of the century, the need for efficient and proven data quality frameworks has also grown.
There are two types of data quality frameworks typically referenced in the industry:
- The first type is the best practices defined by non-profit organizations and industry consortiums like the Data Quality Assessment Framework (DQAF) developed by the International Monetary Fund (IMF). This framework is comprehensive and helpful, but it’s also conceptual and traces its origins back to 1997 when data engineering was quite different.
- The second type is open-source projects such as Apache Griffin, initially developed by eBay and accepted as an Apache Incubator Project in 2016. It works with batch and streaming data and defines a Domain-Specific Language (DSL) for data quality checks. It is free, but the downside is that it requires data engineers to commit to deploying and supporting a significant project independently.
Modern data pipelines ingest data at different velocities and simultaneously employ a dozen technologies to ingest, cleanse, transform, schedule, analyze, and store data, creating a complex process that requires a practical, flexible, extensible, and well-supported data quality framework.
In this article, we’ll cover the best practices provided by data frameworks like DQAF relevant to modern data pipelines, share practical code examples for tasks such as profiling and enriching data (in Python for Apache Spark), and introduce a data quality framework capable of combining data lineage with operational insights to perform quality checks on data at rest and data in motion to determine the root cause of typical data quality problems.
Summary of Key Data Quality Framework Concepts
#1 Data Governance
Data governance is the act of managing data in such a way that there are clear guidelines about who is responsible for the data, who can use it, and who can interact with it. Good data governance ensures that data is treated like a valuable asset, and in turn, it ensures decisions regarding essential data are carefully considered because of the implied accountability. The critical components of an effective data governance plan are:
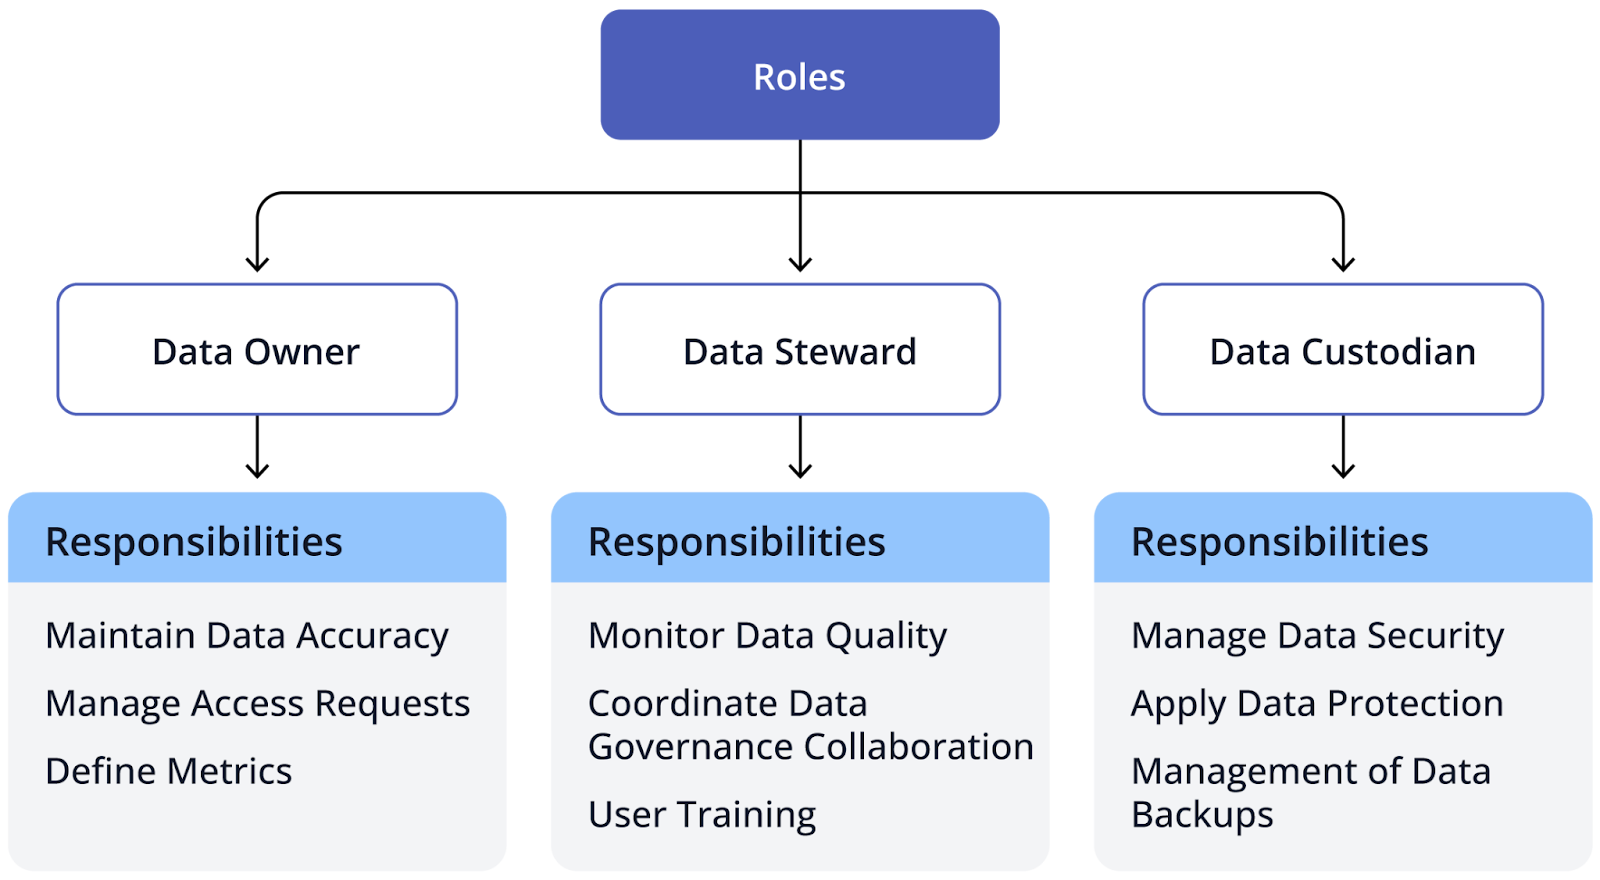
- Roles and responsibilities: To maintain data quality, data owners, stewards, and custodians should be defined, with a set of responsibilities attributed to each role.
- Usage Policies: Privacy and security filters should be developed to control who can access specific data and how they can interact with it.
- Compliance Regulations: Integrating legal requirements into data systems (such as GPDR- General Data Protection Regulation) to comply with national and international data regulations
Data quality frameworks are often used to implement data governance into a project. They help establish an organizational structure for the project, specifying roles and responsibilities and easing the burden of doing this manually. Below is the typical division of roles that a framework helps develop:
Another critical aspect of data governance is data cataloging and metadata management. Being able to quickly inspect your entire data system and use metadata to filter or group data makes data governance more efficient. Pantomath, a platform specializing in data observability, provides users with a unified view of all data within their ecosystem, coupled with metadata management, improving their ability to perform complex and advanced data searches.
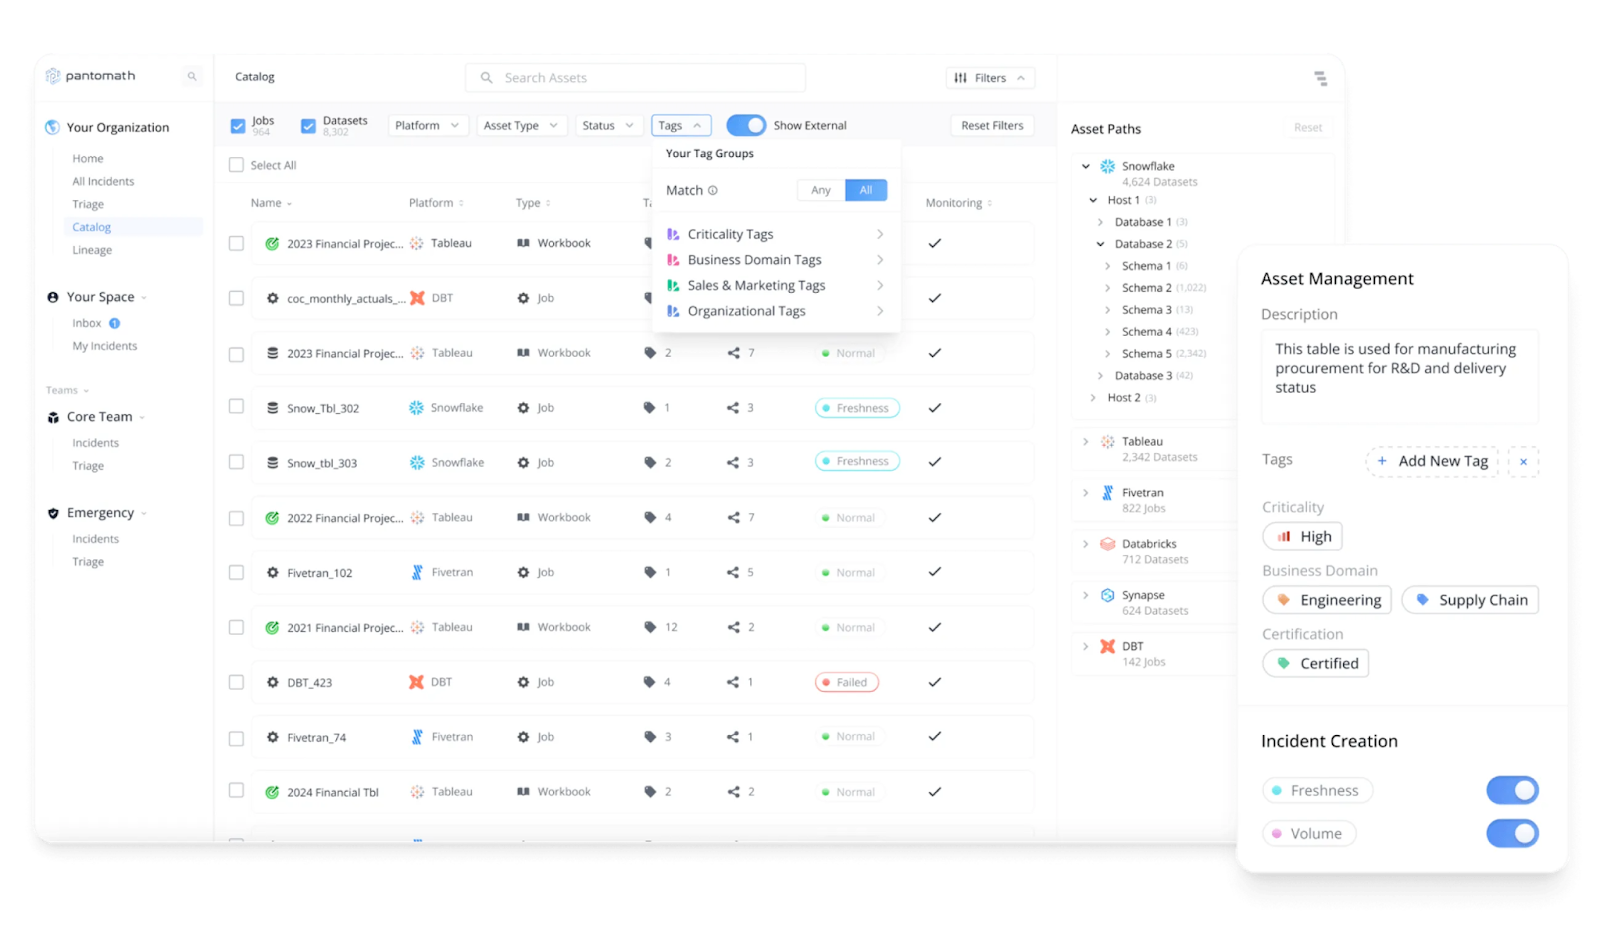
As can be seen, data governance is an essential aspect of a data quality framework, as good governance leads to better quality and less mismanaged data.
#2 Data Pipeline Traceability
Modern data projects are moving towards integrating data quality checks embedded within the pipelines of their transformation processes. This makes it easy to customize complex checks in line with transformations instead of checking data once it has exited the pipeline. Data pipeline traceability is the process of monitoring how data moves through pipelines and flagging real-time and potential issues when they are identified.
The purpose of monitoring pipelines so closely is ultimately to improve data quality. The more information you have about the lineage of your data, the easier it is to optimize your pipelines. For example, let's consider a retail company that sets up a framework in its environment to introduce pipeline traceability. From then on, sales data captured on point-of-sales systems will be tagged with metadata (ID, timestamp, etc.). Next, any changes made to persisted data would also be logged, creating a chain of modification events. If the company discovers any inventory discrepancies, it can track the problematic data back to the source and quickly fix the inaccurate logic. The creation of such an audit trail also improves compliance adherence.
Pantomath provides a data quality framework built on the foundation of pipeline traceability. The functionality of conventional data management platforms is limited to tracking data lineage throughout the pipeline, primarily focused on data at rest when stored in databases in between the stages where data is aggregated, transformed, and analyzed. Pantomath’s innovative approach correlates data at rest and data in motion (while being transformed or analyzed before being stored) with operational insights, such as a failed or delayed batch job, to isolate the root cause of the problems along the data’s journey in the pipeline. If a data quality check fails, it is flagged as a ”Data Quality Incident,” which includes the relevant operational insights that caused the check’s failure, and the downstream impact is visualized for the engineer to investigate.
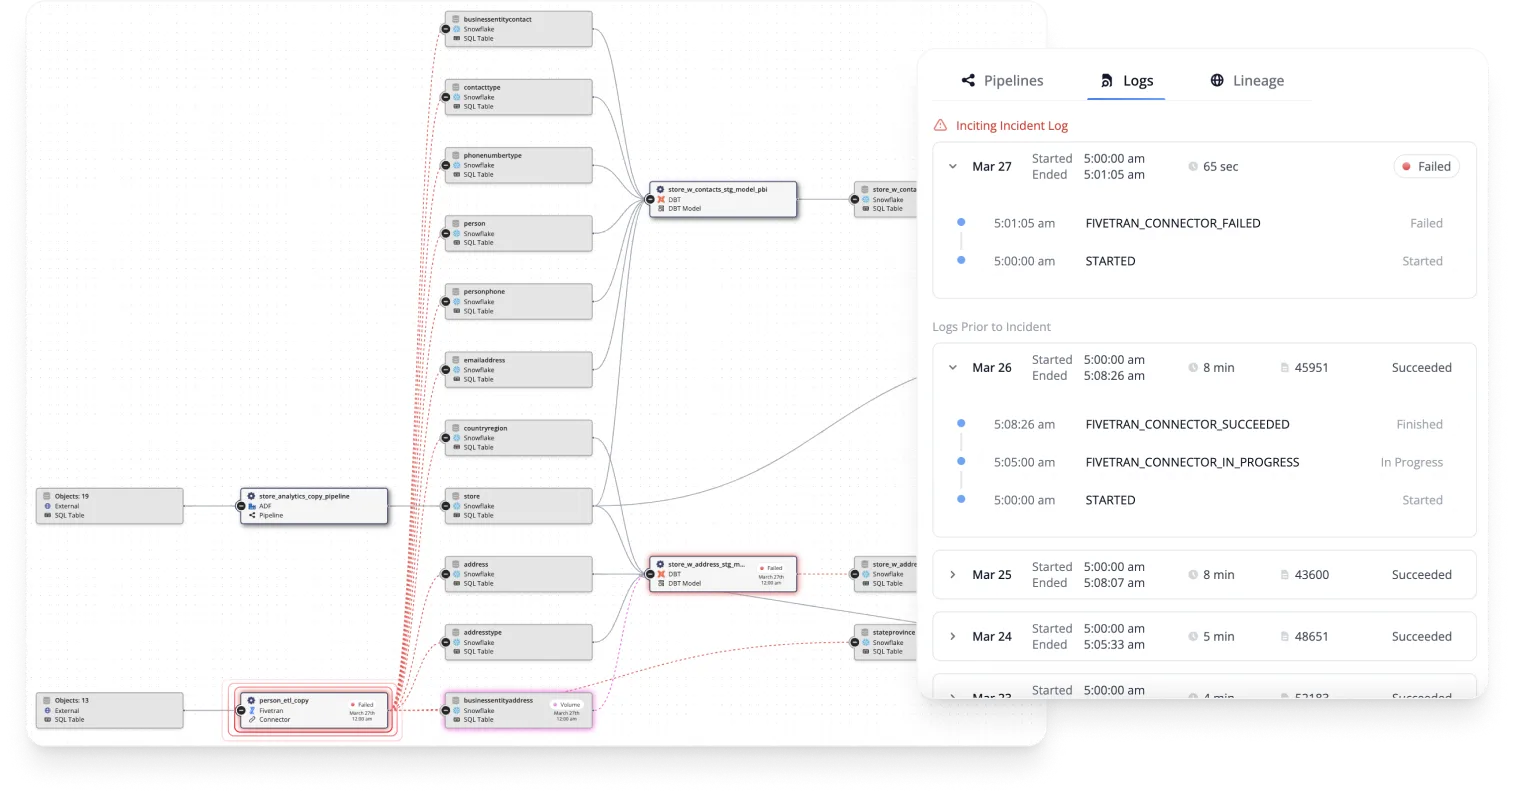
The high level of detail Pantomath provides from its pipeline-embedded checks allows for quick troubleshooting and immediate corrective actions. Traceability should ultimately be about taking action to solve pipeline-related issues, and a good data quality framework optimizes this process.
{{banner-large="/banners"}}
#3 Data Profiling
Data profiling is the assessment of the quality and accuracy of data. Profiling typically comprises multiple steps, primarily involving the structure and content of data. The purpose of data profiling is to help organizations evaluate the quality of their data, identify potential issues or inaccuracies, and find data anomalies. The following are some typical technical objectives of profiling:
- Column Profiling: Isolated analysis of data columns to look for data type consistency, missing values, and erroneous data.
- Cross-Field Analysis: Validation of consistency of data shared across different columns
- Pattern Recognition: Using regex expression to make sure that certain data types (dates, names, etc.) are in the correct format
- Quality Assessment: Using pre-determined rules to evaluate the overall quality of data based on various criteria.
The following is an example of a Python script used with Apache Spark to show profiling of a simplified set of data:
from pyspark.sql import SparkSession
from pyspark.sql.functions import col, count, countDistinct, when

spark = SparkSession.builder \
	.appName("Data Profiling") \
	.getOrCreate()

# Sample data
data = [
	(1, 'customer1@example.com', 100.0, '2022-01-01'),
	(2, 'customer2@example.com', 200.0, '2022-02-15'),
	(3, 'invalid_email', None, '2021-12-31'),
	(4, 'customer4@example.com', -50.0, '2022-03-20'),
	(5, 'customer5@example.com', 150.0, '2021-11-01'),
	(None, 'customer6@example.com', 300.0, '2022-05-05'),
	(7, 'customer7@example.com', None, '2022-06-10'),
	(8, None, 400.0, '2022-04-25'),
	(9, 'customer9@example.com', 500.0, '2022-05-30'),
	(1, 'customer1@example.com', 600.0, '2022-01-15')]

# Create DataFrame
columns = ['customer_id', 'email', 'purchase_amount', 'signup_date']
df = spark.createDataFrame(data, columns)

# Column Profiling
column_profile = df.select(
	[countDistinct(col(c)).alias(f"unique_{c}") for c in df.columns] +
	[count(when(col(c).isNull(), c)).alias(f"null_{c}") for c in df.columns]
)
column_profile.show()

# Invalid email addresses
invalid_emails = df.filter(~col('email').rlike(r'^[\w\.-]+@[\w\.-]+\.\w+$'))
invalid_emails.show()

# Negative purchase amounts
negative_purchases = df.filter(col('purchase_amount') < 0)
negative_purchases.show()

# Duplicate customer IDs
duplicate_ids = df.groupBy('customer_id').agg(count('*').alias('count')).filter(col('count') > 1)
duplicate_ids.show()

# Stop Spark session
spark.stop()
The above example completes a few basic profiling tasks on a set of sample data that records customer purchases. The script first profiles the columns by looking separately for unique and null values. Then, we perform a few data quality checks to look for invalid emails, negative purchases, and duplicate purchases. Ideally, in a real-world situation, all these profiling activities would be consolidated into a visualized report for data engineers to examine. Integrating a sound data quality framework into your project automates common checks like the above and effortlessly provides visually oriented results to the data management team. More complex checks can be configured via the framework UI based on the project's business needs.
Ultimately, the primary objectives of data profiling are:
- Improved data quality: Implementing checks early on can promote smooth data volumes and processing scalability.
- Improved decision-making: Decisions based on high-quality data can be made with more confidence and accurate analysis.
- Optimized data management: The management of pipelines is much smoother when there is less erroneous or faulty data.
#4 Data Enrichment
Data enrichment is arguably the most critical and actionable measure in a data quality framework. Once pitfalls are identified in datasets through processes like profiling and traceability, data enrichment is responsible for improving data quality and sometimes pipelining architecture. Enrichment often involves inserting additional fields to data rather than correcting inaccuracies. As mentioned before, higher-quality data can provide organizations with the ability to make better-informed decisions and gain deeper insights into their alignment with the associated business. A typical data quality framework involves the following processes to enrich data:
- Establishing data quality standards: Users can enter metrics that serve as objectives for quality standards. These metrics are typically based on accuracy, completeness, and relevance. Data quality standards are usually drawn up while keeping organizational goals in mind.
- Investigating data sources: Examining the relevance and reliability of data sources to identify areas for improvement and gather additional information that could be extracted to enrich existing data.
- Data cleansing and validation: Iterating through datasets to correct inaccuracies, standardize data, and remove duplicates. This is done repeatedly until data quality standards are met.
Similar to our previous example, the below Python script is used with Spark to perform some basic data cleansing operations:
from pyspark.sql import SparkSession
from pyspark.sql.functions import col, count, when

# Initialize Spark session
spark = SparkSession.builder \
	.appName("Data Enrichment") \
	.getOrCreate()

# Sample existing customer data
data = [
	(1, 'customer1@example.com', 'John Doe', 100.0),
	(2, 'customer2@example.com', 'Jane Smith', 200.0),
	(3, 'invalid_email', 'Alice Brown', None),
	(4, 'customer4@example.com', 'Bob Johnson', -50.0),
	(5, 'customer5@example.com', 'Charlie White', 150.0),
]

# Create DataFrame
df = spark.createDataFrame(data, ['customer_id', 'email', 'name', 'purchase_amount'])

# Establish Data Quality Standards
data_quality_standards = {'accuracy': 95, 'completeness': 90}

# Function to calculate metrics
def calculate_metrics(dataframe):
	total = dataframe.count()
	valid_emails = dataframe.filter(col('email').rlike(r'^[\w\.-]+@[\w\.-]+\.\w+$')).count()
	accuracy = (valid_emails / total) * 100 if total > 0 else 0
	complete = (dataframe.filter(col('purchase_amount').isNotNull()).count() / total) * 100 if total > 0 else 0
	return accuracy, complete

# Investigate Data Sources
accuracy, completeness = calculate_metrics(df)
source_relevance = "High" if accuracy >= 90 else "Medium" source_reliability = "High" if completeness >= 90 else "Medium"

# Output source investigation results
print(f"Investigating Data Sources: Customer Records (Relevance: {source_relevance}, Reliability: {source_reliability})")

# Data Cleansing
df_cleaned = df.na.fill({'purchase_amount': 0}).dropDuplicates(['email'])
df_validated = df_cleaned.filter(col('email').rlike(r'^[\w\.-]+@[\w\.-]+\.\w+$'))

# Calculate and check data quality metrics
accuracy, completeness = calculate_metrics(df_validated)
print(f"Accuracy: {accuracy:.2f}% (Target: {data_quality_standards['accuracy']}%)")
print(f"Completeness: {completeness:.2f}% (Target: {data_quality_standards['completeness']}%)")

if accuracy >= data_quality_standards['accuracy'] and completeness >= data_quality_standards['completeness']:
	print("Data quality standards met.")
else:
	print("Data quality standards not met. Further cleansing required.")

# Stop Spark session
spark.stop()
In this example, we clean a few customer purchase records stored in a dataset. This is done by setting up quality metrics, investigating sources, cleaning data (accuracy and completeness), and finally informing the user whether the updated data meets the quality standards. While the above example looks relatively straightforward, when dealing with large organizational structures and voluminous data, integrating a data quality framework is recommended to perform data enrichment. The pros of using a data quality framework over manual scripts for data enrichment are:
- Improved accuracy
- Convenient streamlining of processes
- Automated and periodic cleansing of data
- Enrichment reports and UI visualizations
- Detecting opportunities for data enrichment using automated data checks.
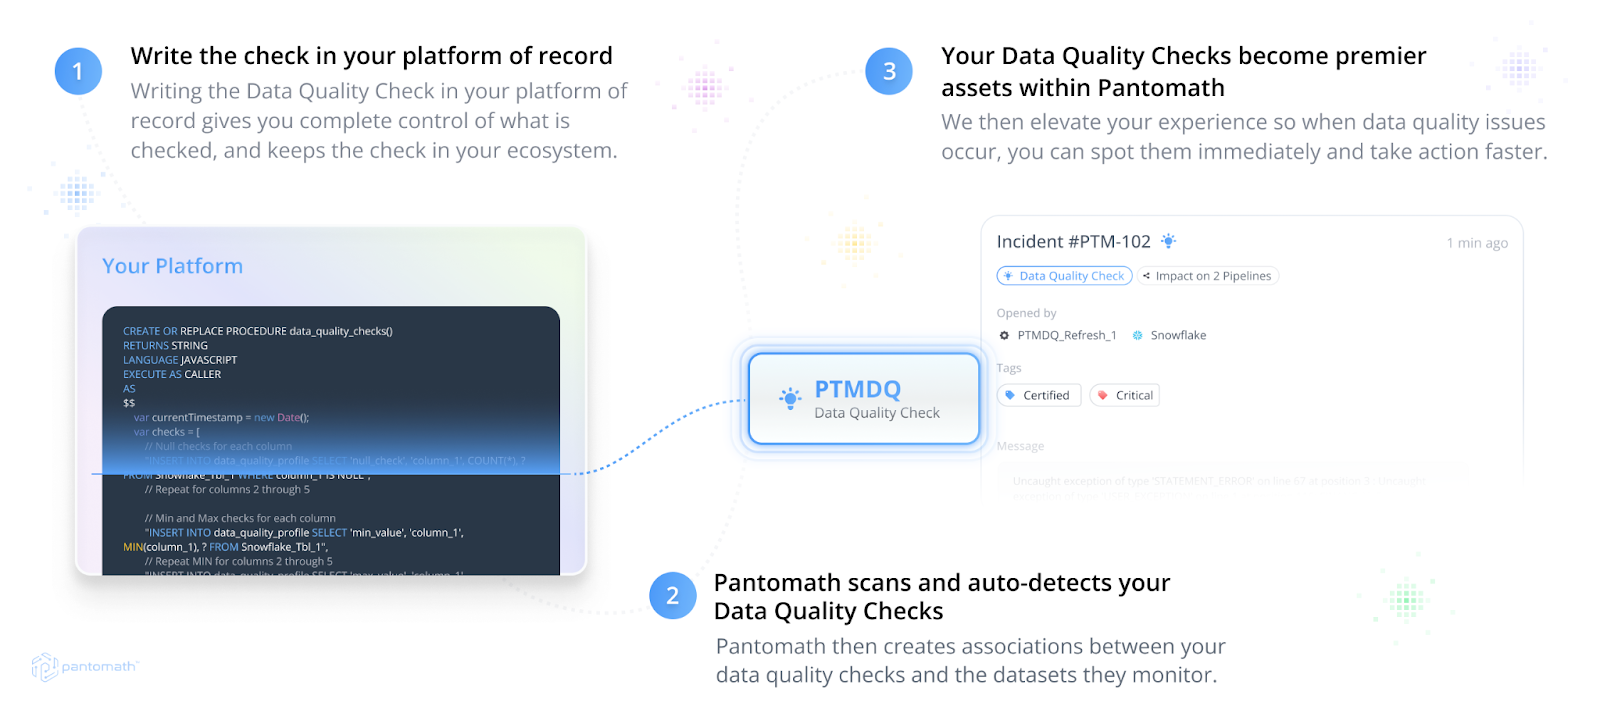
Pantomath's Data Quality Framework allows users to create automated, customizable data checks for their organization’s ecosystem. If a data check fails, then users are alerted, and further steps can be taken to cleanse or enrich the data as necessary.
#5 Monitoring and Reporting
Monitoring and reporting are among the most advantageous outcomes of implementing a data quality framework into your project. Monitoring pipelines over a period of time can give businesses a deeper understanding of data trends and common inaccuracies and promote accountability among teams. Reporting is the result of continuous monitoring, typically materializing in the delivery of information to key stakeholders within the organization.

For example, let’s consider an e-commerce company that has recently decided to implement a data quality framework into a pipeline that monitors customer purchases. They would take the following steps to create a comprehensive monitoring process:
- Defining KPIs (Key Performance Indicators): The data management team would decide on standards for accuracy (valid email IDs, accurate costs, etc.), completeness (complete customer profiles), and consistency (purchases are constant among all datasets) and then input these standards into the quality framework.
- Automate Monitoring Processes: Set up the framework to monitor data quality at different steps, such as input, transformation, and refinement. Depending on the organization's needs, jobs could be scheduled daily, monthly, etc.
- Analyze Results: The data management team periodically analyzes the framework's findings to identify pitfalls, inaccurate sources, and inefficient transformations.
- Review With Stakeholders: Stakeholders such as business analysts and salespersons are consulted to discuss findings and formulate improvement plans.
- Review With Data Teams: The results from the above steps are communicated to data teams, who ultimately develop quality improvement plans if necessary.
When data-driven companies implement similar processes such as the above, they iteratively improve their data integrity and collaboration with different stakeholders and teams within the business. Consequently, business decisions can be made with a greater level of confidence and research.
{{banner-small-1="/banners"}}
Last thoughts
In this article, we reviewed the benefits that data quality frameworks bring to data-driven projects and businesses. These frameworks improve data integrity, reliability, and accuracy, developing a greater sense of collaboration and confidence within the organization. Data quality frameworks like Pantomath that enable quality checks integrated into pipeline workflows can benefit from optimization and downstream impact visualizations. Ultimately, businesses implementing data quality frameworks must carefully consider their objectives before initiating quality control workflows and set achievable and reasonable data quality standards.


